
Inclusion – An evidence based approach using Organisational Network Analytics
A lot of organisations are talking about inclusion, and yet very few are measuring it.
Progress towards an inclusive culture could be accelerated by measuring your culture and solving for the unique issues that are impeding inclusion for you.
The problem is that many organisations don’t know where to start when it comes to measuring inclusion. They revert to engagement surveys that infrequently take a pulse on culture rather than continuously measuring inclusive behaviour in the flow of work.
Measuring inclusion using Organisational Network Analytics (ONA) can provide unique insights into who is in which of your ‘in groups’ and who is in the ‘out group’. Best of all this can be done as a side effect of day to day interaction to give a real-time view of the state of play without imposing overhead on workers.
Appreciation and recognition is a good proxy for inclusion because whether you have a specific system for this or simply use email, a slack channel, or similar, these interactions can be filtered out to find out how discretionary communication (rather than forced or work related information) flows.
Let’s look at some insights found for organisations that have adopted ONA as part of their approach to building inclusive cultures.
Gender and inclusion
A large professional services firm discovered that the way that males and females interact is very different.
Their gender mix was 52% male 48% female with good balance through 6 layers of leadership but with a slightly more male dominated upper layer. From a diversity point of view this organisation appears to be in very good shape looking at their metrics.
Studying appreciation and recognition interactions as a proxy for inclusion gave some interesting insights about inclusion though.
The male network
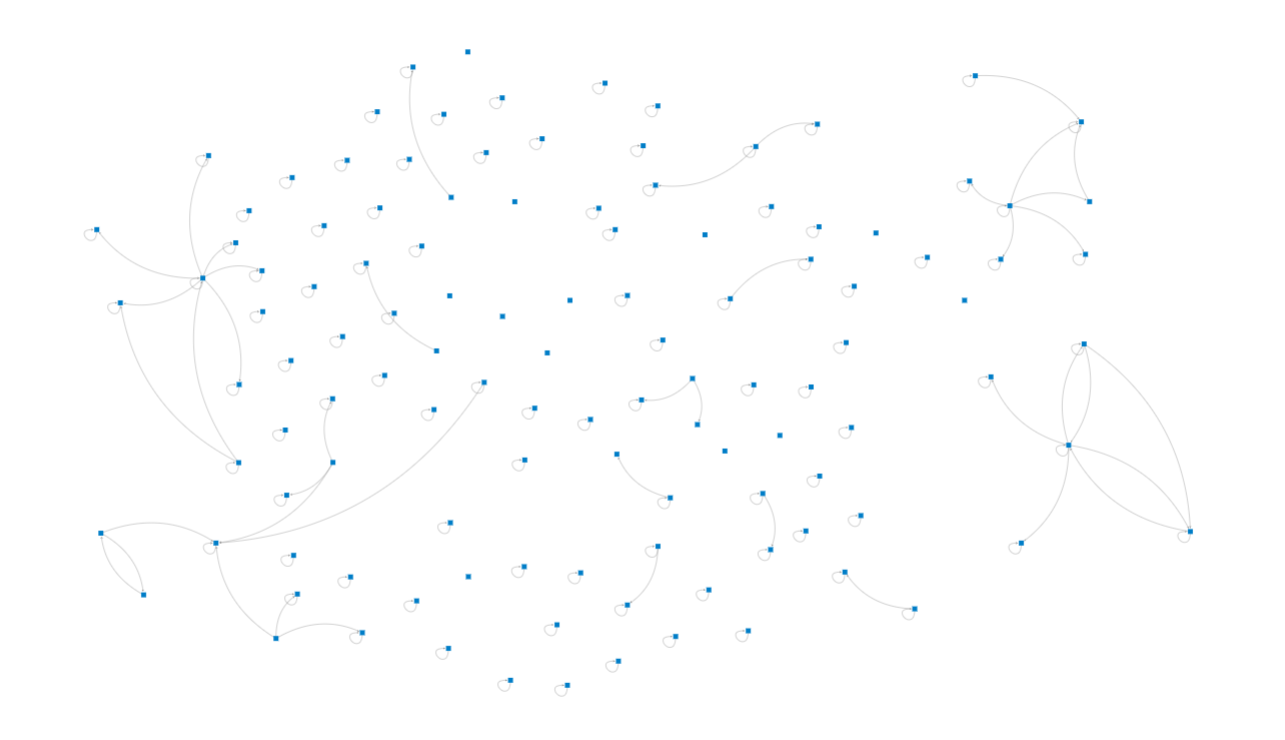
The male network shows few interconnections. The interconnections that do exist are typically between manager and team member. Male interactions predominantly flow down the organisational hierarchy with little networking effect and little feeding up.
The female network
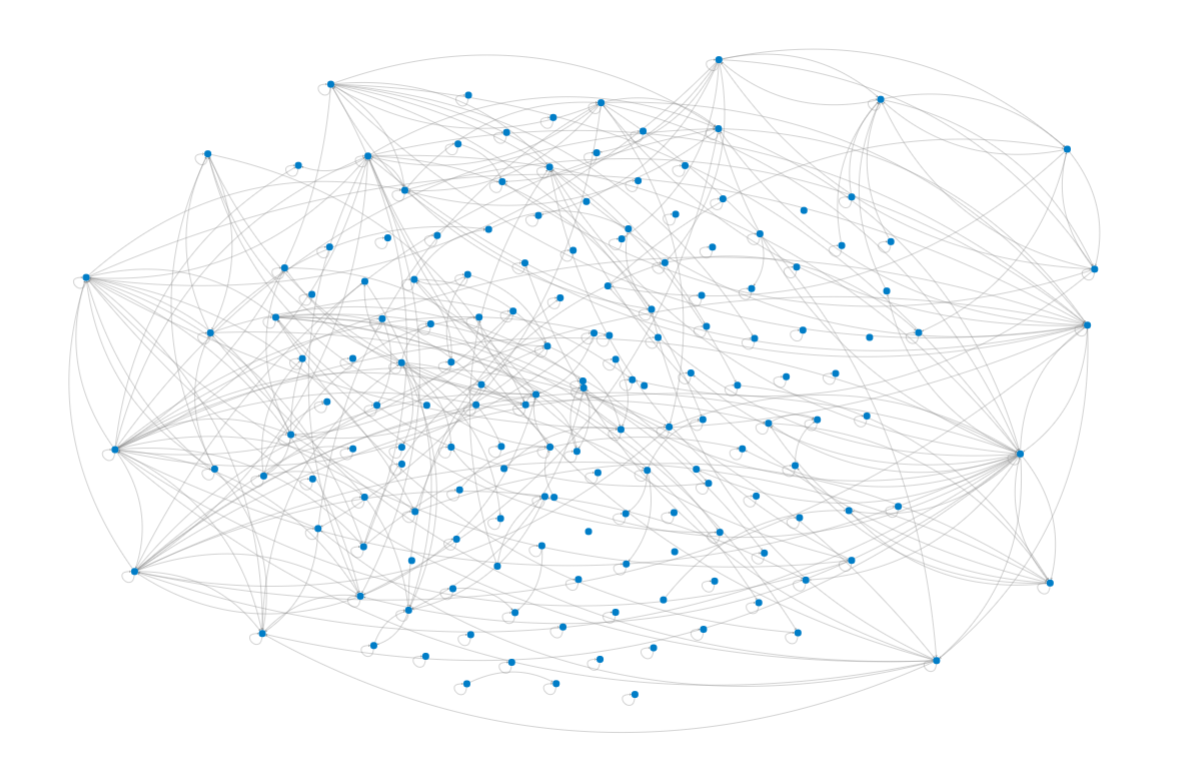
The female network on the other hand has many more interconnections. These are between women at all levels of the organisation irrespective of formal management lines. Interaction happens between women up, down and across the organisation, and there is much more of it.
Mixed gender interactions; female to male, and male to female were much closer to the male interaction model than the female one.
So, the females in this organisation were much more inclusive of each other, and males were far less inclusive of other males and other female workers.
Given the flow of information hierarchically downwards for men, males towards the top of the organisation would get little interaction upwards in comparison to their female equivalent.
Stretching a little bit, and as a hypothesis still being explored, it could be that as male’s experience less and less inclusion themselves on the way up, they are not pre-conditioned to be inclusive of others beyond direct reports by the time they assume senior leadership positions. If so, this would infer that inclusive behaviours have to be relearned under such circumstances.
For this organisation, knowing there is a different pattern of discretionary interaction within the male and female workforce helps to tailor programs such as change, development, and communication, so that they fit with the relationship dynamics that are in play instead of being one-size-fits-all programs.
It has also meant that senior leaders have been encouraged to elicit regular feedback for themselves since it is unlikely to be offered unprompted.
Marginalised by management
In a different case, this time an aged care group, the inclusive behaviours of the leadership team were studied.
By looking at the direction of growth of their interaction network over several weeks they uncovered a spectrum of inclusiveness amongst leaders.
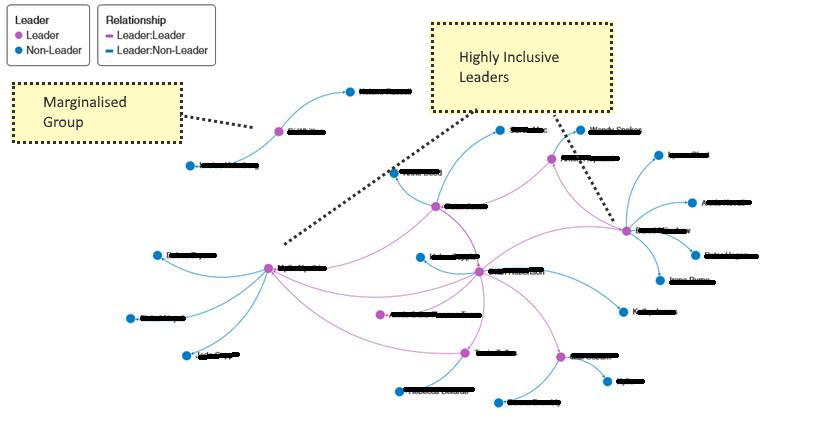
Week 1 – Leaders are in their own ‘in group’ connecting to each other, with some inclusion beyond the leadership group. One leader and their team is factionalised.
Week 2 – Leaders are starting to reveal the degree to which they include others.
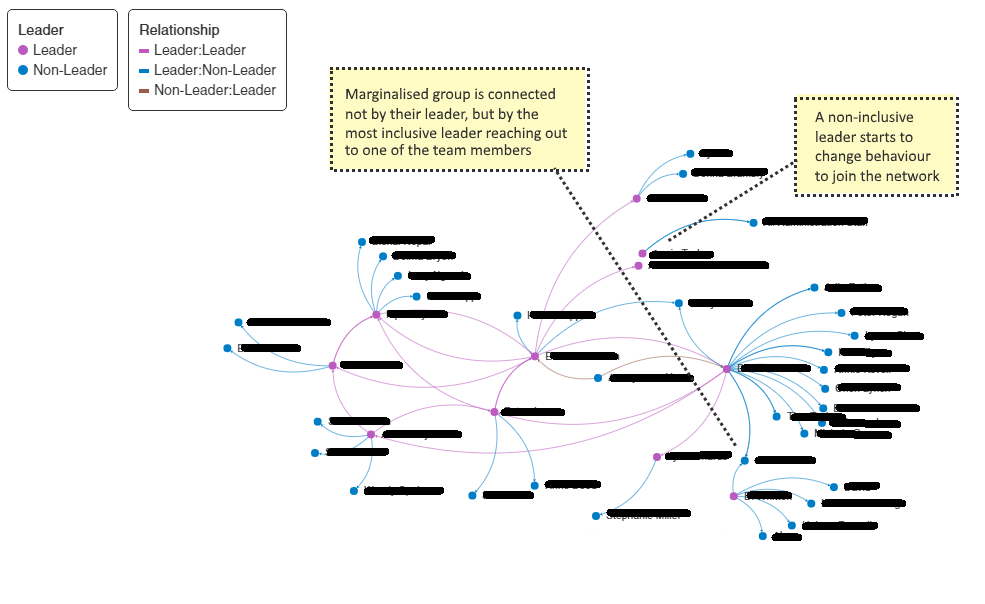
Week 4 – Non-inclusive leaders start to join in (the number of pink nodes has increased). Factionalised group is connected in to the main group.
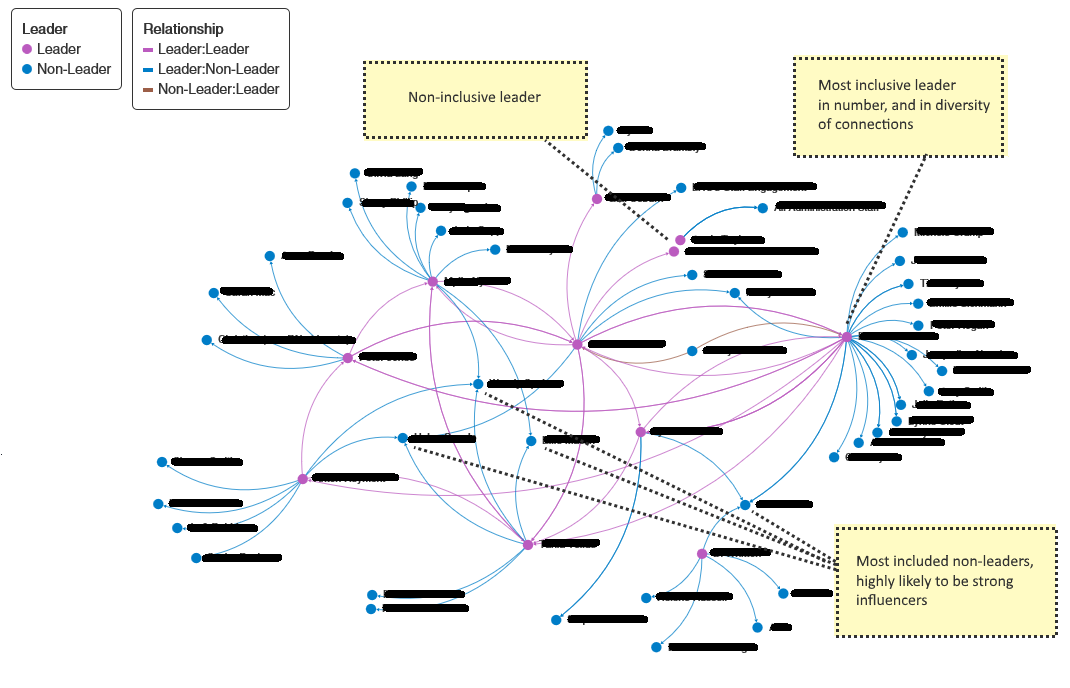
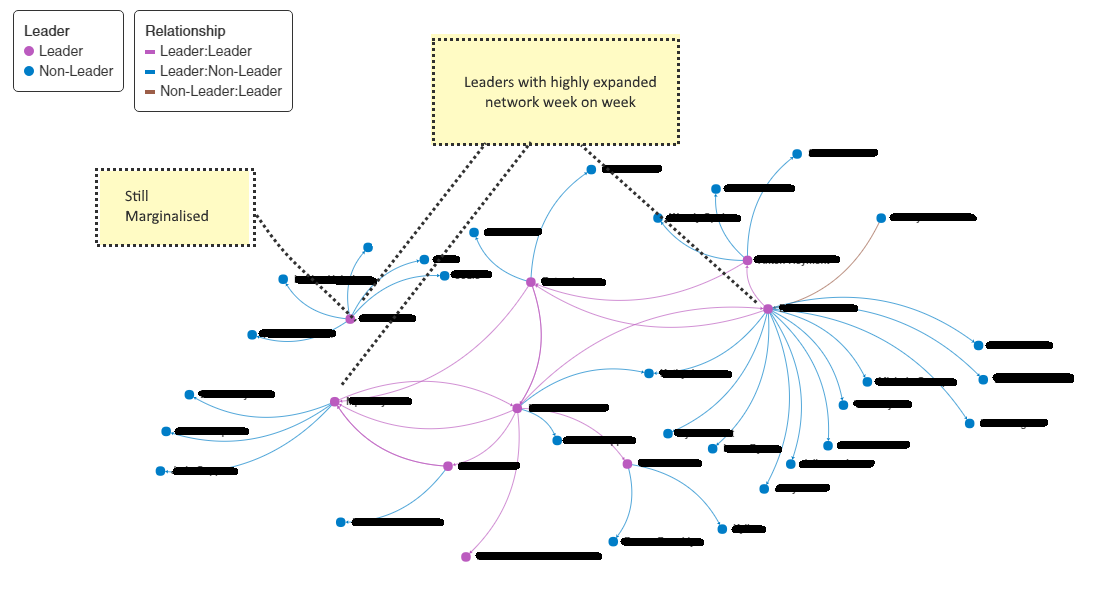
Week 7 – The differing degrees of inclusiveness amongst the leaders is clear. Prospective informal leaders (influencers) start to appear. The growth rate of the network is slowing, so those not yet included are likely to be feeling marginalised.
By the end of week 7, a 10x difference could be observed in the inclusiveness of the most inclusive leaders compared to the least inclusive.
Interestingly the leaders’ self-perception of their own inclusiveness was inconsistent with their actual behaviours. Some of the leaders claiming to be the most inclusive were in fact the least inclusive of all. By shielding their team members, which in their minds was protecting them, they were disadvantaging them from showing up and feeling socially connected to the organisation at large.
A positive outcome of measuring inclusion in this organisation was that non-inclusive leaders started to modify their behaviours. Simply by creating the visibility that they and their people were in an ‘out group’ was a powerful means to actually improve the leaders’ behaviours. By week 4 the most isolating leaders started to feel pressure to belong, and slowly started to include their teams in the exercise.
For this organisation these insights were able to show which leaders needed individual development. It highlighted which non-leaders were highly included and how those people might be informal influencers in the organisation. Further, the groups of workers who were absent from the network after the 7 week stage could be examined to understand why those people were not being recognised for their work.
Summing up
Both organisations were surprised by the insights they learned by measuring inclusion using Organisational Network Analysis.
They did not intuitively recognise the patterns of behaviour until visualisations highlighted what was really happening amongst their people.
Once they did see what was going on, they were is a much stronger position to positively change behaviour, both with individual and group learning as well as better structured communication.
There are a multitude of analytical approaches that can be used to measure culture. These do not need to generate additional work for workers, or take a long time, or cost a fortune to yield value.
Pay Compliment is a real-time continuous engagement platform to help organisations measure, manage and improve culture through the 4A’s of high performance; Alignment, Assessment, Assistance and Appreciation. We can help you to design and execute a culture change program using analytics for measurement. Contact us today to learn more.